Optical Spectrometer Analysis Attachment
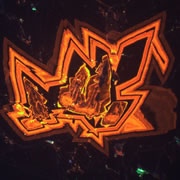
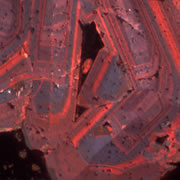
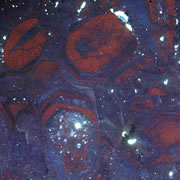
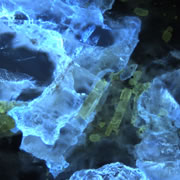
Image Gallery
Scientific Papers
Overview
Optical Spectrometer Analysis Attachment which fits to the Microscope to measure the results from the Electron beam on a specimen area.
There are various grating ranges available from 200 – 1100 nm and the resolution is from 0.2 nm with a 100µm Slit size on a 3600 lines/mm grating.
The system can also be offered as a dual system allowing measurements with two different gratings in real time for comparative analysis.
Software Functionality
Spectrum Collection Software
- Auto wavelength calibration
- Drift correction
- Automatic periodical spectrum save
- External collection trigger
- Conversion to J-CAMP for further processing
- FWHM calculations
- Integral calculations
- Auto configuration of spectrum collection time
- Auto detection of pixel saturation
Colour Application Software
- Providing an accurate method of colour determination as defined by CIE committee
- The laptop comes with AvaSoft 8.16.1.0
Scale Options
What resolution do I need?
The optical resolution is defined as the minimum difference in wavelength that can be separated by the spectrometer. For separation of two spectral lines it is necessary to image them at least two array-pixels apart. The grating determines how far different wavelengths are separated (dispersed) at the detector array, it and is an important variable for the resolution. The other important parameter is the width of the light beam entering the spectrometer. This is basically the installed fixed entrance slit in the spectrometer, or the fibre core when no slit is installed. We use a 100μm core fibre connection to the spectometer which typically has a 100μm slit.
The image on the detector array for a given wavelength will cover a number of pixels. For two spectral lines to be separated, it is now necessary that they be dispersed over at least this image size plus one pixel. Resolution can be improved by using a slit that is smaller than the diameter of the fibre core. This effectively reduces the width of the entering light beam. It should be noted that the light sensitivity of the spectrometer is reduced by the square of the reduction in slit size. So a 50μm slit will require 4x the amount of light for the same number of counts, or 4x the collection time. As a result noise will also increase.
The influence of the chosen grating and the effective width of the light beam (fibre core or entrance slit) are shown in the tables at included with the product information.
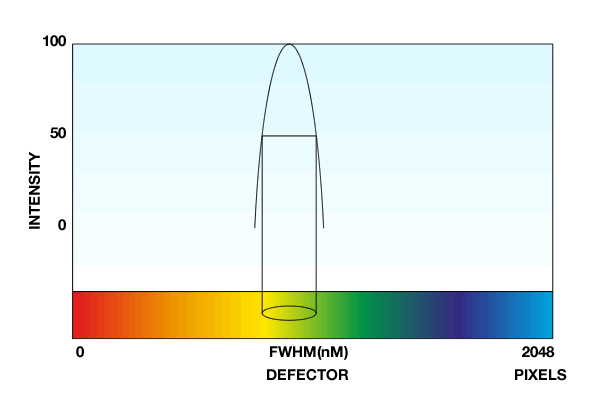
The resolution in this table is defined as F(ull) W(idth) H(alf) M(aximum), which is defined as that is the width in nm of the peak at 50% of the maximum intensity (see Figure).
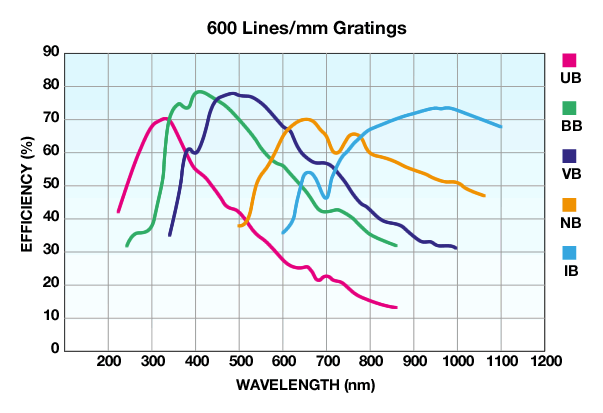
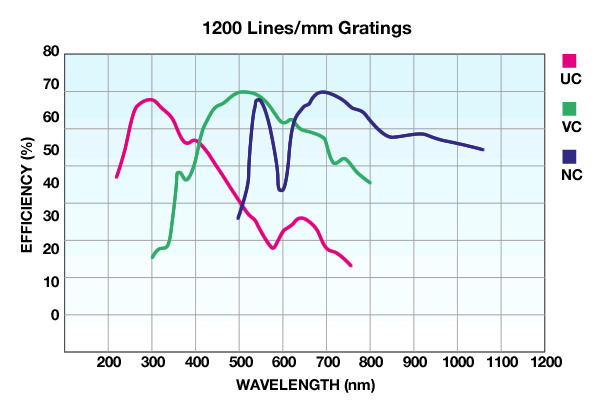
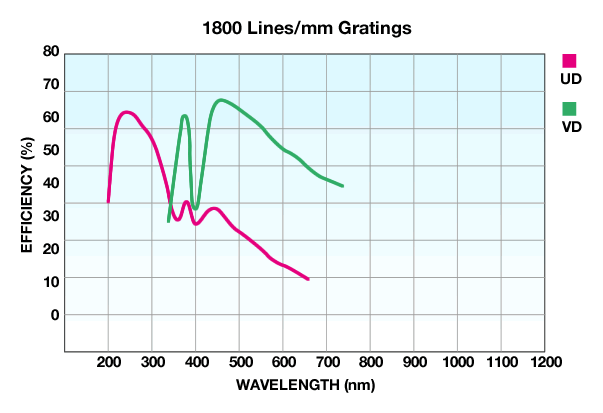
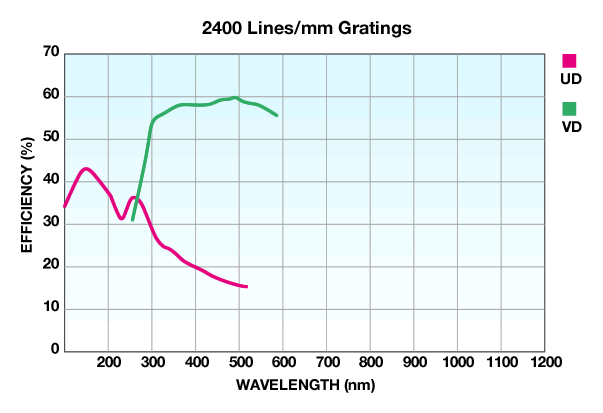
It is important for best performance to match the grating to the spectrum that is being investigated.
The wider the range of the spectrometer the lower the resolution.
If a grating is chosen that maximises the range of the spectrometer, ie 180-1100nm, the best FWHM will be:
- 1100 -180 = 920nm
- Detector consists of 2048 14um x 200μm pixels
- 920/2048 = 0.44nm per pixel
- Slit size is 100μm so 100/14 = 7 pixels
- FWHM resolution = 7 x 0.44 nm = 3.08
- If the only visible range required is 390 - 760 nm the calc is
- 760-390 = 370nm
- 370/2048 = 0.18
- 7 x 0.18 = 1.26 nm FWHM
|
Resolution (FWHM in nm) for the Spec-2048 with 100 (μm) Slit size
| Lines/mm |
Max resolution nm |
| 300 | 4.3 |
| 600 | 2.1 |
| 1200 | 0.7 - 1.0 * |
| 1800 | 0.4 - 0.7 * |
| 2400 | 0.3-0.5 * |
| 3600 | 0.2-0.3 * |
*dependant on the starting wavelength of the grating; the higher the wavelength, the greater the dispersion and the higher the resolution
|
|
|
|
|
|
| Use | Useable range(nm) | Spectral range(nm) | Lines/mm | Blaze(nm) | Order code |
|---|---|---|---|---|---|
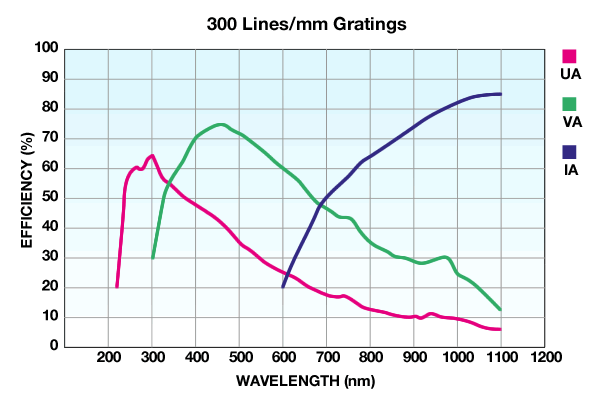
| UV/VIS/NIR | 200-1100** | 900 | 300 | 300 | UA |
| UV/VIS | 200-850 | 520 | 600 | 300 | UB |
| UV | 200-750 | 250-220* | 1200 | 250 | UC |
| UV | 200-650 | 165-145* | 1800 | UV | UD |
| UV | 200-580 | 115-70* | 2400 | UV | UE |
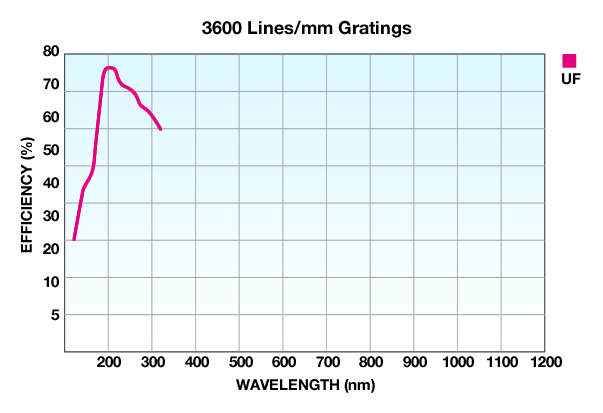
| UV | 220-400 | 75-50* | 3600 | UV | UF |
| UV/VIS | 250-850 | 520 | 600 | 400 | BB |
| VIS/NIR | 300-1100** | 800** | 300 | 500 | VA |
| VIS | 360-1000 | 500 | 600 | 500 | VB |
| VIS | 300-800 | 250-200* | 1200 | 500 | VC |
| VIS | 350-750 | 145-100* | 1800 | 500 | VD |
| VIS | 350-640 | 75-50* | 2400 | VIS | VE |
| NIR | 500-1050 | 500 | 600 | 750 | NB |
| NIR | 500-1050 | 220-150* | 1200 | 750 | NC |
| NIR | 600-1100** | 500** | 300 | 1000 | IA |
| NIR | 600-1100 | 500 | 600 | 1000 | IB |
* Dependant on starting wavelength of the grating; the higher the wavelength, the greater the dispersion and the smaller the range to select.
** please note not all 2048pixels will be in the useable range.
This is the grating selected by most of our customers for normal CL. with the range set to 300nm to 820nm